
Ambulance Waiting Times: Are They Improving?

Published by Stephen Milward in Medical · Thursday 19 Mar 2026 · 4 minutes
Tags: Ambulance, Waiting, Times, Patients, Treatment, Healthcare, Improvement, Emergency, Services
Tags: Ambulance, Waiting, Times, Patients, Treatment, Healthcare, Improvement, Emergency, Services
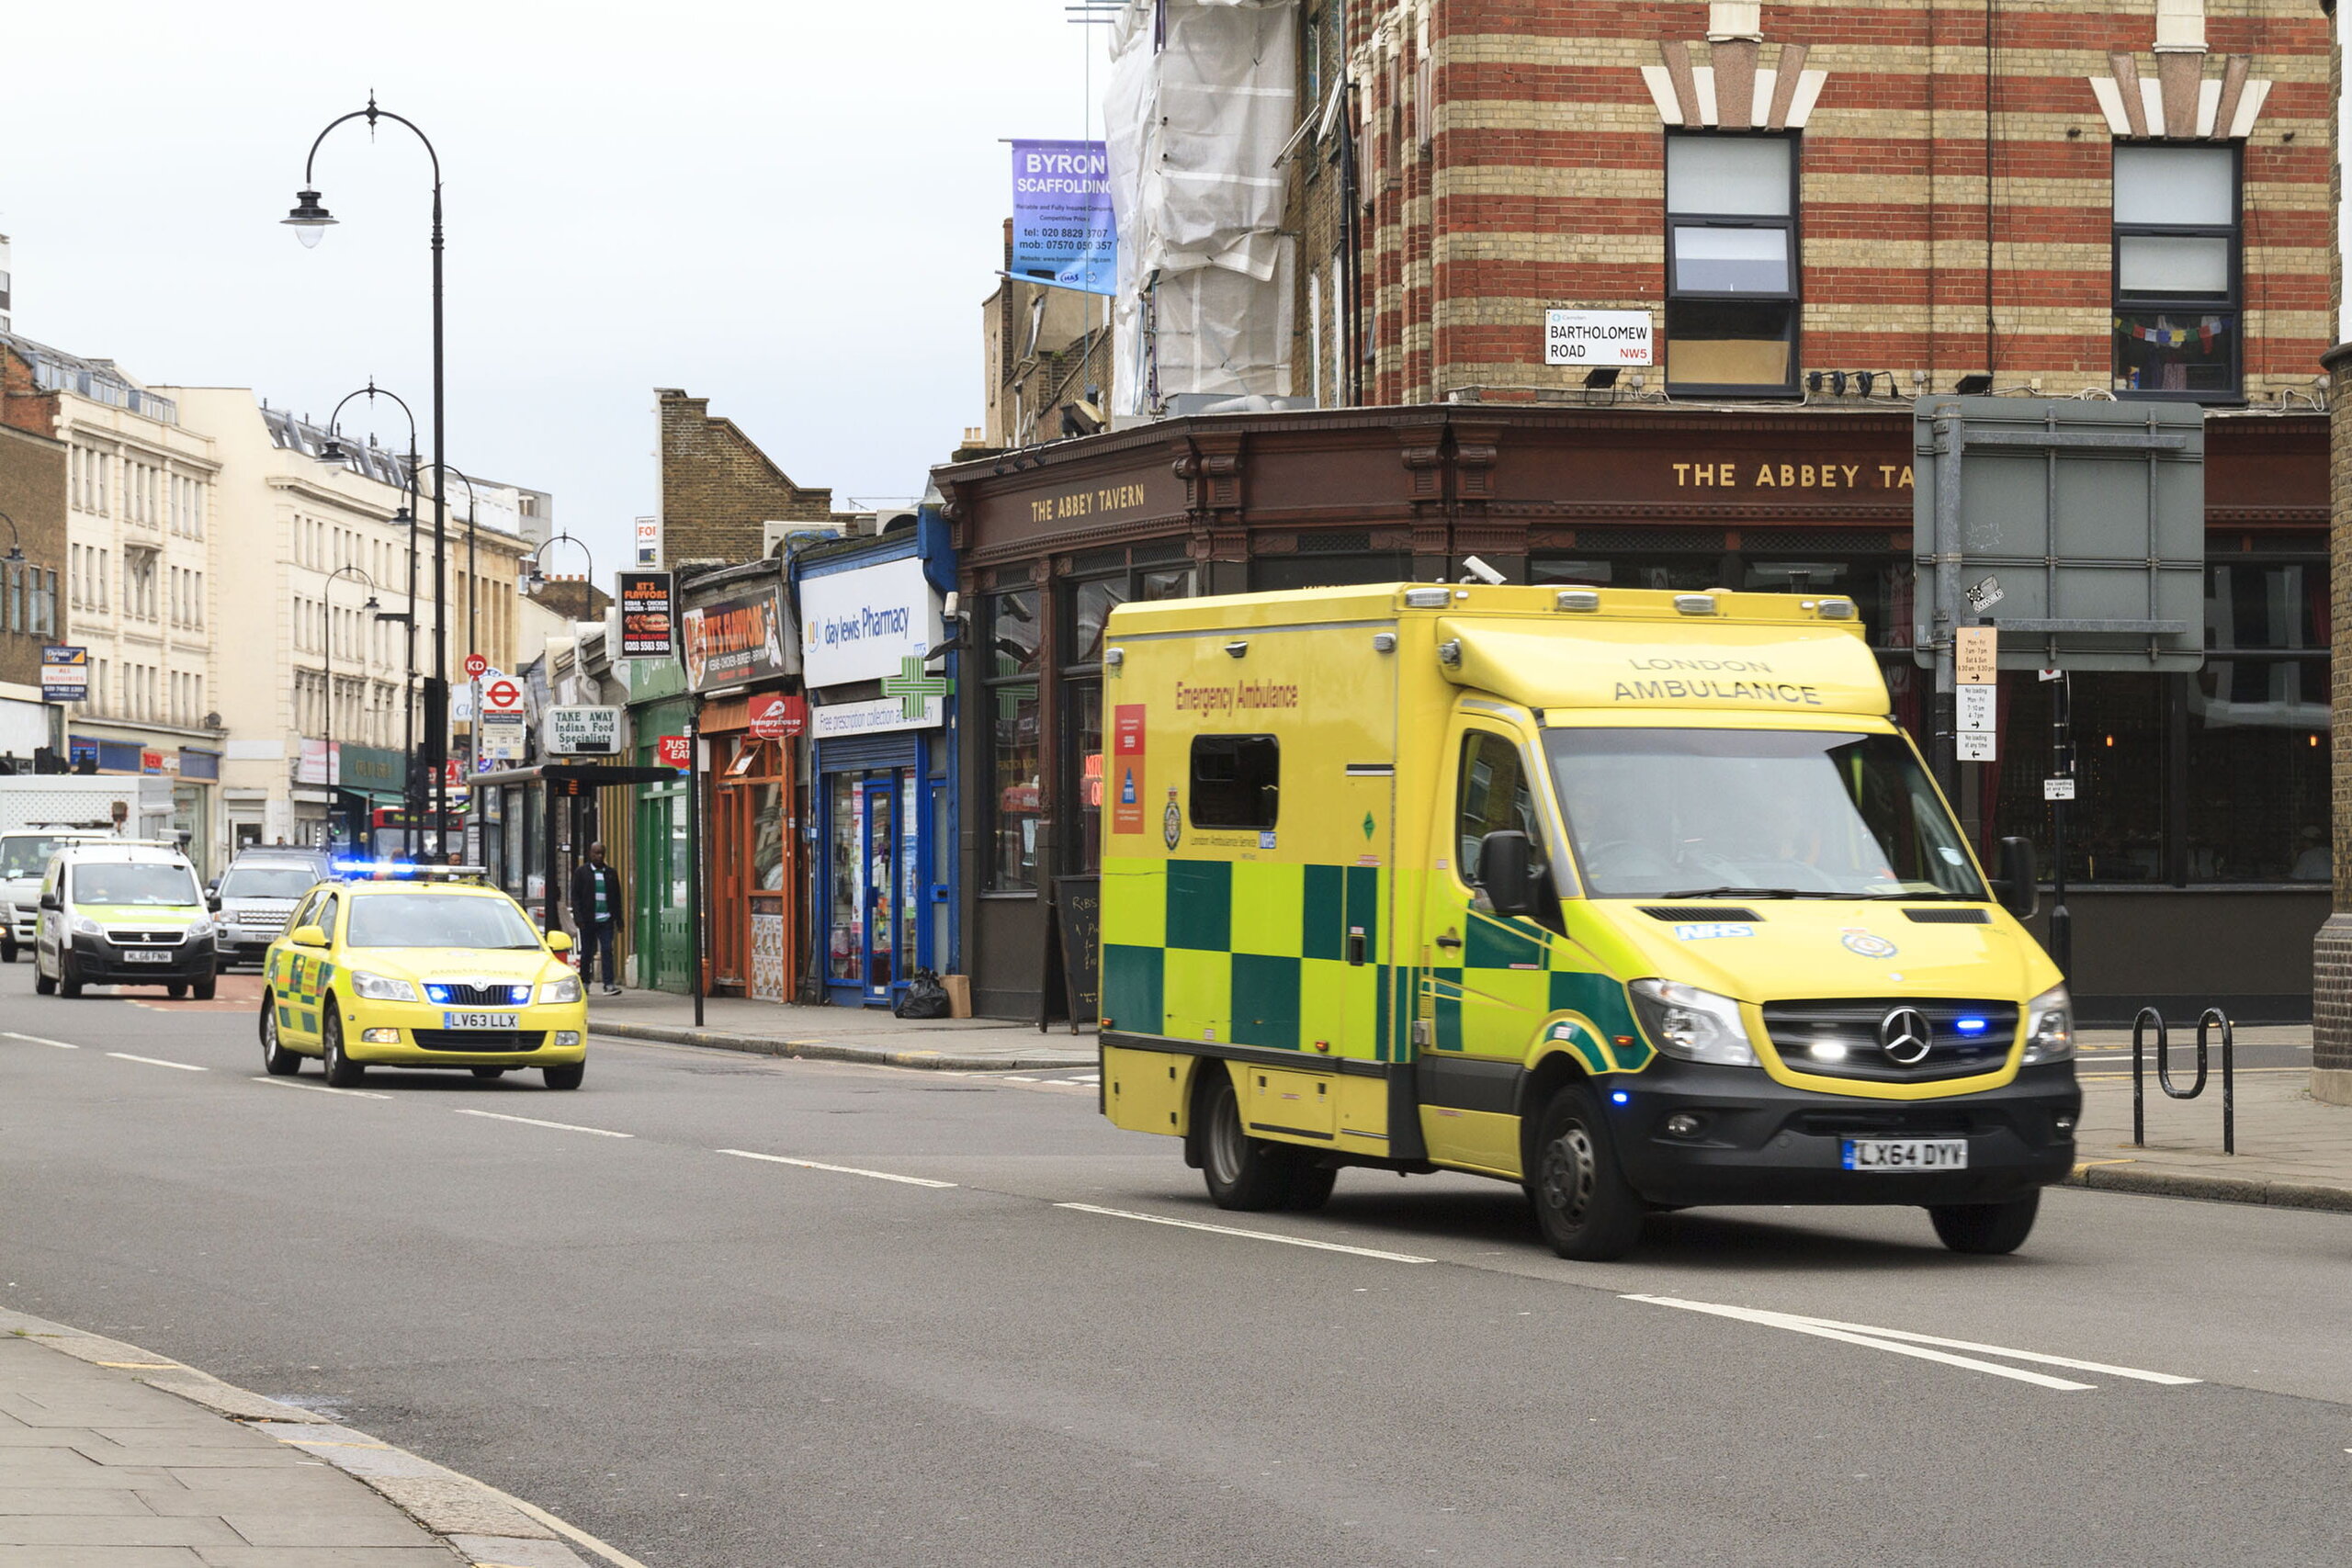
At some point in our lives, we will need medical help that needs an ambulance to attend a situation. This happened to us this week. Denise was clearly very ill and when I called 999, I was told the wait time would be 'up to five hours'. I was also told not to phone asking when the ambulance would attend. After ten hours, a car with two paramedics arrived.
Why is this? Why do we put up with such a low level of service? Why was the time given so wrong?
Money.
That's it in a word. It's not the commitment of staff in the NHS, it's the lack of resource. The NHS releases data on ambulance response times. Below is an extract from the data regarding February 2026 times.
Statistical Note: Ambulance Quality Indicators (AQI) (i)
The C1, C2 and C3 mean response times in February 2026 were all quicker than in February 2025, and all four categories had the quickest mean response time since August 2025.
Of patients treated by Ambulance Services in October 2025 after a certain kind of heart attack, the proportion receiving the recommended care was higher than in nearly all of the last ten years.
1. Ambulance Systems Indicators (AmbSYS)
1.1 Response times
For C1 for England, the mean response time in February 2026 was 7 minutes 50 seconds, and the 90th centile was 13:59. These are both the quickest since August 2025. The average standard of 7 minutes has not been met since April 2021 but the 90th centile standard of 15 minutes has been met in every month of 2025/26 so far.
For C1T (time to the arrival of the transporting vehicle for C1 incidents), the average was 9:37, and the 90th centile was 17:17.
The February 2026 England C2 average was 28:57, the quickest since August 2025. The 90th centile was 59:29, also the quickest since August 2025.
For England in February 2026, the C3 average was 1:42:24, the quickest since August 2025. The 90th centile was 3:52:29, also the quickest since August 2025.
The C4 mean was 2:18:11, and the 90th centile 5:26:52.
1.2 Other Systems Indicators
The average handover time in England in February 2026 was 31:02. This is quicker than January 2026 but slower than November and December 2025.
The February 2026 mean 999 call answer time was 3 seconds, similar to other months of 2025/26 so far, and quicker than all months of 2022 and 2023.
In February 2026, 752,407 calls to 999 were answered in England, or 26.9 thousand per day. There were 737,526 incidents, or 26.3 thousand per day, over 1,300 more per day than there were in February 2025. Of those, 354,764 (12.7 thousand per day) required conveyance to Emergency Department (ED).
Ambulance Services in England closed 18.5% of incidents on the telephone (Hear & Treat) in February 2026, lower than the previous 3 months but higher than every other month this decade. The proportion closed on scene (See & Treat) was 28.7%. Other incidents comprised 48.1% with conveyance to ED and 4.7% with conveyance elsewhere.
Do you notice that each section starts with a sort of triumphalist statement or conclusion? Are we not capable of drawing our own conclusions from the data? I suspect that patients may draw different conclusions based on experiences.
Now, I realise that one example isn't necessarily an indicator of a trend, but I don't see a wait of ten hours in the above. Sorry, won't cut it anymore. The NHS needs to be properly resourced and if that means higher taxation, so be it. You can moan about that after your loved one is dead because of delays.
